Using airspeed velocity
airspeed velocity is designed to benchmark a single project over its lifetime using a given set of benchmarks. Below, we use the phrase “project” to refer to the project being benchmarked, and “benchmark suite” to refer to the set of benchmarks – i.e., little snippets of code that are timed – being run against the project.
The benchmark suite may live inside the project’s repository, or it may reside in a separate repository – the choice is up to you and is primarily a matter of style or policy. Note also that the result data is stored in JSON files alongside the benchmark suite and may grow quite large, and you may want to plan where to store it.
You can interact with airspeed velocity through the asv
command. Like git, the asv command has a number of
“subcommands” for performing various actions on your benchmarking
project.
Setting up a new benchmarking project
The first thing to do is to set up an airspeed velocity benchmark
suite for your project. It must contain, at a minimum, a single
configuration file, asv.conf.json, and a directory tree of Python
files containing benchmarks.
The asv quickstart command can be used to create a new
benchmarking suite. Change to the directory where you would like your
new benchmarking suite to be created and run:
$ asv quickstart
· Setting up new Airspeed Velocity benchmark suite.

Which of the following template layouts to use:
(1) benchmark suite at the top level of the project repository
(2) benchmark suite in a separate repository

Layout to use? [1/2] 1

· Edit asv.conf.json to get started.
Answer ‘1’ if you want a default configuration suitable for putting the benchmark suite on the top level of the same repository where your project is, or ‘2’ to get default configuration for putting it in a separate repository.
Now that you have the bare bones of a benchmarking suite, let’s edit
the configuration file, asv.conf.json. Like most files that
airspeed velocity uses and generates, it is a JSON file.
There are comments in the file describing what each of the elements do, and there is also a asv.conf.json reference with more details. The values that will most likely need to be changed for any benchmarking suite are:
version: Version of theasv.conf.jsonspec. As ofv0.6.4, there is only version1.project: The Python package name of the project being benchmarked.project_url: The project’s homepage.repo: The URL or path to the DVCS repository for the project. This should be a read-only URL so that anyone, even those without commit rights to the repository, can run the benchmarks. For a project on github, for example, the URL would look like:https://github.com/airspeed-velocity/asv.gitThe value can also be a path, relative to the location of the configuration file. For example, if the benchmarks are stored in the same repository as the project itself, and the configuration file is located at
benchmarks/asv.conf.jsoninside the repository, you can set"repo": ".."to use the local repository.show_commit_url: The base of URLs used to display commits for the project. This allows users to click on a commit in the web interface and have it display the contents of that commit. For a github project, the URL is of the formhttps://github.com/$OWNER/$REPO/commit/.environment_type: The tool used to create environments. May beconda,virtualenv,rattler, oruv. If Conda supports the dependencies you need, that is the recommended method, but Rattler is faster. See Environments for more information.matrix: Dependencies you want to preinstall into the environment where benchmarks are run.default_benchmark_timeout: The maximum time in seconds that a benchmark is allowed to run before it is terminated. This is useful to prevent benchmarks from running indefinitely if they get stuck. The default is 60 seconds.
The rest of the values can usually be left to their defaults, unless you want to benchmark against multiple versions of Python or multiple versions of third-party dependencies, or if your package needs nonstandard installation commands.
Once you’ve set up the project’s configuration, you’ll need to write
some benchmarks. The benchmarks live in Python files in the
benchmarks directory. The quickstart command has created a
single example benchmark file already in
benchmarks/benchmarks.py:
# Write the benchmarking functions here.
# See "Writing benchmarks" in the asv docs for more information.


class TimeSuite:
    """
    An example benchmark that times the performance of various kinds
    of iterating over dictionaries in Python.
    """

    def setup(self):
        self.d = {}
        for x in range(500):
            self.d[x] = None

    def time_keys(self):
        for key in self.d.keys():
            pass

    def time_values(self):
        for value in self.d.values():
            pass

    def time_range(self):
        d = self.d
        for key in range(500):
            d[key]


class MemSuite:
    def mem_list(self):
        return [0] * 256
You’ll want to replace these benchmarks with your own. See Writing benchmarks for more information.
Running benchmarks
Benchmarks are run using the asv run subcommand.
Let’s start by just benchmarking the latest commit on the current
main branch of the project:
$ asv run
Machine information
If this is the first time using asv run on a given machine, (which
it probably is, if you’re following along), you will be prompted for
information about the machine, such as its platform, cpu and memory.
airspeed velocity will try to make reasonable guesses, so it’s
usually ok to just press Enter to accept each default value. This
information is stored in the ~/.asv-machine.json file in your home
directory:
I will now ask you some questions about this machine to identify
it in the benchmarks.

1. machine: A unique name to identify this machine in the results.
   May be anything, as long as it is unique across all the
   machines used to benchmark this project.  NOTE: If changed from
   the default, it will no longer match the hostname of this
   machine, and you may need to explicitly use the --machine
   argument to asv.
machine [cheetah]:
2. os: The OS type and version of this machine.  For example,
   'Macintosh OS-X 10.8'.
os [Linux 3.17.6-300.fc21.x86_64]:
3. arch: The generic CPU architecture of this machine.  For
   example, 'i386' or 'x86_64'.
arch [x86_64]:
4. cpu: A specific description of the CPU of this machine,
   including its speed and class.  For example, 'Intel(R) Core(TM)
   i5-2520M CPU @ 2.50GHz (4 cores)'.
cpu [Intel(R) Core(TM) i5-2520M CPU @ 2.50GHz]:
5. ram: The amount of physical RAM on this machine.  For example,
   '4GB'.
ram [8055476]:
Note
If you ever need to update the machine information later, you can
run asv machine.
Note
By default, the name of the machine is determined from your
hostname. If you have a hostname that frequently changes, and
your ~/.asv-machine.json file contains more than one entry,
you will need to use the --machine argument to asv run and
similar commands.
Environments
Next, the Python environments to run the benchmarks are set up.
asv always runs its benchmarks in an environment that it creates,
in order to not change any of your existing Python environments. One
environment will be set up for each of the combinations of Python
versions and the matrix of project dependencies, if any. The first
time this is run, this may take some time, as many files are copied
over and dependencies are installed into the environment. The
environments are stored in the env directory so that the next time
the benchmarks are run, things will start much faster.
Environments can be created using different tools. By default,
asv ships with support for anaconda,
rattler, and
virtualenv. The
environment_type key in asv.conf.json is used to select the
tool used to create environments.
When using virtualenv, asv does not build Python interpreters
for you, but it expects to find the Python versions specified
in the asv.conf.json file available on the PATH. For example,
if the asv.conf.json file has:
"pythons": ["3.7", "3.12"]
then it will use the executables named python3.7 and
python3.12 on the path. There are many ways to get multiple
versions of Python installed – your package manager, apt-get,
yum, MacPorts or homebrew probably has them, or you
can also use pyenv.
The virtualenv environment also supports PyPy. You can specify
"pypy" or "pypy3" as a Python version number in the
"pythons" list. Note that PyPy must also be installed and
available on your PATH.
Benchmarking
Finally, the benchmarks are run:
$ asv run
· Cloning project.
· Fetching recent changes
· Creating environments......
· Discovering benchmarks
·· Uninstalling from virtualenv-py3.7
·· Building 4238c44d <main> for virtualenv-py3.7
·· Installing into virtualenv-py3.7.
· Running 10 total benchmarks (1 commits * 2 environments * 5 benchmarks)
[  0.00%] · For project commit 4238c44d <main>:
[  0.00%] ·· Building for virtualenv-py3.7.
[  0.00%] ·· Benchmarking virtualenv-py3.7
[ 10.00%] ··· Running (benchmarks.TimeSuite.time_iterkeys--)....
[ 30.00%] ··· benchmarks.MemSuite.mem_list                                 2.42k
[ 35.00%] ··· benchmarks.TimeSuite.time_iterkeys                     11.1±0.01μs
[ 40.00%] ··· benchmarks.TimeSuite.time_keys                         11.2±0.01μs
[ 45.00%] ··· benchmarks.TimeSuite.time_range                        32.9±0.01μs
[ 50.00%] ··· benchmarks.TimeSuite.time_xrange                       30.3±0.01μs
[ 50.00%] ·· Building for virtualenv-py3.12..
[ 50.00%] ·· Benchmarking virtualenv-py3.12
[ 60.00%] ··· Running (benchmarks.TimeSuite.time_iterkeys--)....
[ 80.00%] ··· benchmarks.MemSuite.mem_list                                 2.11k
[ 85.00%] ··· benchmarks.TimeSuite.time_iterkeys                          failed
[ 90.00%] ··· benchmarks.TimeSuite.time_keys                          9.07±0.5μs
[ 95.00%] ··· benchmarks.TimeSuite.time_range                        35.5±0.01μs
[100.00%] ··· benchmarks.TimeSuite.time_xrange                            failed
To improve reproducibility, each benchmark is run in its own process.
The results of each benchmark are displayed in the output and also recorded on disk. For timing benchmarks, the median and interquartile range of collected measurements are displayed. Note that the results may vary on slow time scales due to CPU frequency scaling, heat management, and system load, and this variability is not necessarily captured by a single run. How to deal with this is discussed in Tuning timing measurements.
The killer feature of airspeed velocity is that it can track the
benchmark performance of your project over time. The range
argument to asv run specifies a range of commits that should be
benchmarked. The value of this argument is passed directly to either git
log or to the Mercurial log command to get the set of commits, so it actually
has a very powerful syntax defined in the gitrevisions manpage, or the
revsets help section for Mercurial.
For example, in a Git repository, one can test a range of commits on a particular branch since branching off main:
asv run main..mybranch
Or, to benchmark all of the commits since a particular tag (v0.1):
asv run v0.1..main
To benchmark a single commit, or tag, use ^! (git):
asv run v0.1^!
Corresponding examples for Mercurial using the revsets specification are also possible.
In many cases, this may result in more commits than you are able to
benchmark in a reasonable amount of time. In that case, the
--steps argument is helpful. It specifies the maximum number of
commits you want to test, and it will evenly space them over the
specified range.
You can benchmark all commits in the repository by using:
asv run ALL
You may also want to benchmark every commit that has already been benchmarked on all the other machines. For that, use:
asv run EXISTING
You can benchmark all commits since the last one that was benchmarked on this machine. This is useful for running in nightly cron jobs:
asv run NEW
You can also benchmark a specific set of commits listed explicitly in a file (one commit hash per line):
asv run HASHFILE:hashestobenchmark.txt
Finally, you can also benchmark all commits that have not yet been benchmarked for this machine:
asv run --skip-existing-commits ALL
Note
You can also do a validity check for the benchmark suite without
running benchmarks, using asv check.
The results are stored as JSON files in the directory
results/$MACHINE, where $MACHINE is the unique machine name
that was set up in your ~/.asv-machine.json file. In order to
combine results from multiple machines, you can for example store the
results in separate repositories, for example git submodules,
alongside the results from other machines. These results are then
collated and “published” altogether into a single interactive website
for viewing (see Viewing the results).
You can also continue to generate benchmark results for other commits,
or for new benchmarks and continue to throw them in the results
directory. airspeed velocity is designed from the ground up to
handle missing data where certain benchmarks have yet to be performed
– it’s entirely up to you how often you want to generate results, and
on which commits and in which configurations.
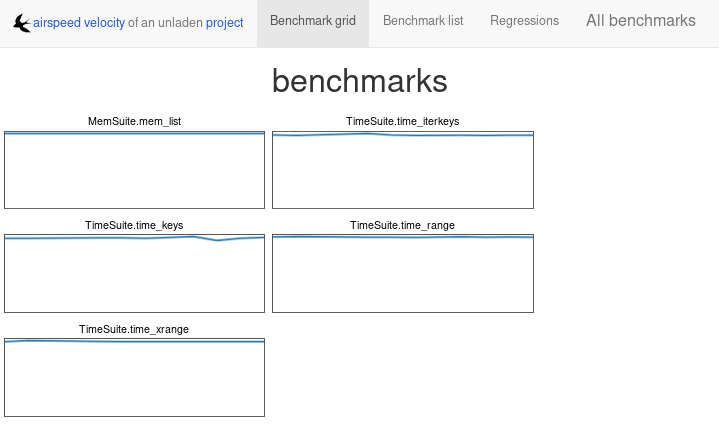
Viewing the results
You can use the asv show command to display results from previous runs on the command line:
$ asv show main
Commit: 4238c44d <main>

benchmarks.MemSuite.mem_list [mymachine/virtualenv-py3.7]
  2.42k
  started: 2018-08-19 18:46:47, duration: 1.00s

benchmarks.TimeSuite.time_iterkeys [mymachine/virtualenv-py3.7]
  11.1±0.06μs
  started: 2018-08-19 18:46:47, duration: 1.00s

...
To collate a set of results into a viewable website, run:
asv publish
This will put a tree of files in the html directory. This website
can not be viewed directly from the local filesystem, since web
browsers do not support AJAX requests to the local filesystem.
Instead, airspeed velocity provides a simple static webserver that
can be used to preview the website. Just run:
asv preview
and open the URL that is displayed at the console. Press Ctrl+C to stop serving.
To share the website on the open internet, simply put the files in the
html directory on any webserver that can serve static content. Github Pages
works quite well, for example. For using Github Pages, asv
includes the convenience command asv gh-pages to put the results
to the gh-pages branch and push them to Github. See asv gh-pages
–help for details.
Managing the results database
The asv rm command can be used to remove benchmarks from the
database. The command takes an arbitrary number of key=value
entries that are “and”ed together to determine which benchmarks to
remove.
The keys may be one of:
benchmark: A benchmark namepython: The version of pythoncommit_hash: The commit hashmachine-related:
machine,arch,cpu,os,ramenvironment-related: a name of a dependency, e.g.
numpy
The values are glob patterns, as supported by the Python standard
library module fnmatch. So, for example, to remove all benchmarks
in the time_units module:
asv rm "benchmark=time_units.*"
Note the double quotes around the entry to prevent the shell from
expanding the * itself.
The asv rm command will prompt before performing any operations.
Passing the -y option will skip the prompt.
Here is a more complex example, to remove all of the benchmarks on
Python 3.7 and the machine named giraffe:
asv rm python=3.7 machine=giraffe
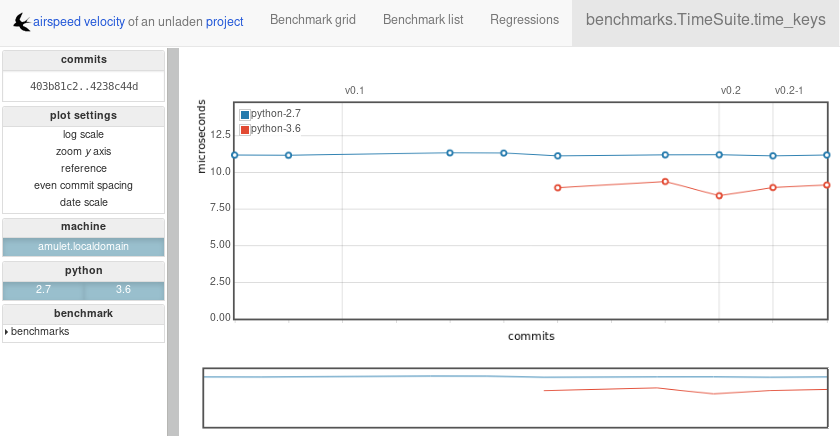
Finding a commit that produces a large regression
airspeed velocity detects statistically significant decreases of
performance automatically based on the available data when you run
asv publish. The results can be inspected via the web interface,
clicking the “Regressions” tab on the web site. The results include
links to each benchmark graph deemed to contain a decrease in
performance, the commits where the regressions were estimated to
occur, and other potentially useful information.
However, since benchmarking can be rather time consuming, it’s likely that
you’re only benchmarking a subset of all commits in the repository.
When you discover from the graph that the runtime between commit A and
commit B suddenly doubles, you don’t necessarily know which particular commit in
that range is the likely culprit. asv find can be used to help
find a commit within that range that produced a large regression using
a binary search. You can select a range of commits easily from the
web interface by dragging a box around the commits in question. The
commit hashes associated with that range is then displayed in the
“commits” section of the sidebar. We’ll copy and paste this commit
range into the commandline arguments of the asv find command,
along with the name of a single benchmark to use. The output below is
truncated to show how the search progresses:
$ asv find 05d4f83d..b96fcc53 time_coordinates.time_latitude
- Running approximately 10 benchmarks within 1156 commits
- Testing <----------------------------O----------------------------->
- Testing <-------------O-------------->------------------------------
- Testing --------------<-------O------>------------------------------
- Testing --------------<---O--->-------------------------------------
- Testing --------------<-O->-----------------------------------------
- Testing --------------<O>-------------------------------------------
- Testing --------------<>--------------------------------------------
- Greatest regression found: 2918f61e
The result, 2918f61e is the commit found with the largest
regression, using the binary search.
Note
The binary search used by asv find will only be effective when
the runtimes over the range are more-or-less monotonic. If there
is a lot of variation within that range, it may find only a local
maximum, rather than the global maximum. For best results, use a
reasonably small commit range.
Running a benchmark in the profiler
airspeed velocity can oftentimes tell you if something got
slower, but it can’t really tell you why it got slower. That’s
where a profiler comes in. airspeed velocity has features to
easily run a given benchmark in the Python standard library’s
cProfile profiler, and then open the profiling data in the tool
of your choice.
The asv profile command profiles a given benchmark on a given
revision of the project.
Note
You can also pass the --profile option to asv run. In
addition to running the benchmarks as usual, it also runs them
again in the cProfile profiler and save the results. asv
profile will use this data, if found, rather than needing to
profile the benchmark each time. However, it’s important to note
that profiler data contains absolute paths to the source code, so
they are generally not portable between machines.
asv profile takes as arguments the name of the benchmark and the
hash, tag or branch of the project to run it in. Below is a real
world example of testing the astropy project. By default, a
simple table summary of profiling results is displayed:
> asv profile time_units.time_very_simple_unit_parse 10fc29cb

     8700042 function calls in 6.844 seconds

 Ordered by: cumulative time

 ncalls  tottime  percall  cumtime  percall filename:lineno(function)
      1    0.000    0.000    6.844    6.844 asv/benchmark.py:171(method_caller)
      1    0.000    0.000    6.844    6.844 asv/benchmark.py:197(run)
      1    0.000    0.000    6.844    6.844 /usr/lib64/python3.7/timeit.py:201(repeat)
      3    0.000    0.000    6.844    2.281 /usr/lib64/python3.7/timeit.py:178(timeit)
      3    0.104    0.035    6.844    2.281 /usr/lib64/python3.7/timeit.py:96(inner)
 300000    0.398    0.000    6.740    0.000 benchmarks/time_units.py:20(time_very_simple_unit_parse)
 300000    1.550    0.000    6.342    0.000 astropy/units/core.py:1673(__call__)
 300000    0.495    0.000    2.416    0.000 astropy/units/format/generic.py:361(parse)
 300000    1.023    0.000    1.841    0.000 astropy/units/format/__init__.py:31(get_format)
 300000    0.168    0.000    1.283    0.000 astropy/units/format/generic.py:374(_do_parse)
 300000    0.986    0.000    1.115    0.000 astropy/units/format/generic.py:345(_parse_unit)
3000002    0.735    0.000    0.735    0.000 {isinstance}
 300000    0.403    0.000    0.403    0.000 {method 'decode' of 'str' objects}
 300000    0.216    0.000    0.216    0.000 astropy/units/format/generic.py:32(__init__)
 300000    0.152    0.000    0.188    0.000 /usr/lib64/python3.7/inspect.py:59(isclass)
 900000    0.170    0.000    0.170    0.000 {method 'lower' of 'unicode' objects}
 300000    0.133    0.000    0.133    0.000 {method 'count' of 'unicode' objects}
 300000    0.078    0.000    0.078    0.000 astropy/units/core.py:272(get_current_unit_registry)
 300000    0.076    0.000    0.076    0.000 {issubclass}
 300000    0.052    0.000    0.052    0.000 astropy/units/core.py:131(registry)
 300000    0.038    0.000    0.038    0.000 {method 'strip' of 'str' objects}
 300003    0.037    0.000    0.037    0.000 {globals}
 300000    0.033    0.000    0.033    0.000 {len}
      3    0.000    0.000    0.000    0.000 /usr/lib64/python3.7/timeit.py:143(setup)
      1    0.000    0.000    0.000    0.000 /usr/lib64/python3.7/timeit.py:121(__init__)
      6    0.000    0.000    0.000    0.000 {time.time}
      1    0.000    0.000    0.000    0.000 {min}
      1    0.000    0.000    0.000    0.000 {range}
      1    0.000    0.000    0.000    0.000 {hasattr}
      1    0.000    0.000    0.000    0.000 /usr/lib64/python3.7/timeit.py:94(_template_func)
      3    0.000    0.000    0.000    0.000 {gc.enable}
      3    0.000    0.000    0.000    0.000 {method 'append' of 'list' objects}
      3    0.000    0.000    0.000    0.000 {gc.disable}
      1    0.000    0.000    0.000    0.000 {method 'disable' of '_lsprof.Profiler' objects}
      3    0.000    0.000    0.000    0.000 {gc.isenabled}
      1    0.000    0.000    0.000    0.000 <string>:1(<module>)
Navigating these sorts of results can be tricky, and generally you
want to open the results in a GUI tool, such as RunSnakeRun or snakeviz. For example, by passing
the --gui=runsnake to asv profile, the profile is collected
(or extracted) and opened in the RunSnakeRun tool.
Note
To make sure the line numbers in the profiling data correctly match the source files being viewed, the correct revision of the project is checked out before opening it in the external GUI tool.
You can also get the raw profiling data by using the --output
argument to asv profile.
Note
Since the method name is passed as a regex, parenthesis need to be escaped, e.g.
asv profile 'benchmarks.MyBench.time_sort\(500\)' HEAD --gui snakeviz
See asv profile for more options.
To extract information from --profile runs of asv:
$ python
import asv
results_asv = asv.results.iter_results(".asv")
res_objects = list(results_asv)
prof_data = res_objects[0].get_profile_stats('benchmarks.MyBench.time_sort')
prof_data.strip_dirs() # Remove machine specific info
prof_data.sort_stats('cumulative').print_stats()
Where different benchmarks may be used. A specific json may also be loaded
directly with asv.results.Results.load(<json_path>), after which
get_profile_stats can be used.
Comparing the benchmarking results for two revisions
In some cases, you may want to directly compare the results for two specific
revisions of the project. You can do so with the compare command:
$ asv compare v0.1 v0.2
All benchmarks:

       before           after         ratio
     [3bfda9c6]       [bf719488]
     <v0.1>           <v0.2>
            40.4m            40.4m     1.00  benchmarks.MemSuite.mem_list [amulet.localdomain/virtualenv-py3.7-numpy]
           failed            35.2m      n/a  benchmarks.MemSuite.mem_list [amulet.localdomain/virtualenv-py3.12-numpy]
      11.5±0.08μs         11.0±0μs     0.96  benchmarks.TimeSuite.time_iterkeys [amulet.localdomain/virtualenv-py3.7-numpy]
           failed           failed      n/a  benchmarks.TimeSuite.time_iterkeys [amulet.localdomain/virtualenv-py3.12-numpy]
         11.5±1μs      11.2±0.02μs     0.97  benchmarks.TimeSuite.time_keys [amulet.localdomain/virtualenv-py3.7-numpy]
           failed      8.40±0.02μs      n/a  benchmarks.TimeSuite.time_keys [amulet.localdomain/virtualenv-py3.12-numpy]
      34.6±0.09μs      32.9±0.01μs     0.95  benchmarks.TimeSuite.time_range [amulet.localdomain/virtualenv-py3.7-numpy]
           failed      35.6±0.05μs      n/a  benchmarks.TimeSuite.time_range [amulet.localdomain/virtualenv-py3.12-numpy]
       31.6±0.1μs      30.2±0.02μs     0.95  benchmarks.TimeSuite.time_xrange [amulet.localdomain/virtualenv-py3.7-numpy]
           failed           failed      n/a  benchmarks.TimeSuite.time_xrange [amulet.localdomain/virtualenv-py3.12-numpy]
This will show the times for each benchmark for the first and second
revision, and the ratio of the second to the first. In addition, the
benchmarks will be color coded green and red if the benchmark improves
or worsens more than a certain threshold factor, which defaults to 1.1
(that is, benchmarks that improve by more than 10% or worsen by 10%
are color coded). The threshold can be set with the
--factor=value option. Finally, the benchmarks can be split
into ones that have improved, stayed the same, and worsened, using the
same threshold using the --split option.
See asv compare for more.
ASV also has a compare column which can be used to get a quick (and colorless)
visual summary of benchmark results. This consists of a single mark where
each of its symbolic states can be understood as:
Change |
Color |
Description |
After |
Before |
|---|---|---|---|---|
|
Light Gray |
Not comparable |
||
|
Red |
Introduced a failure |
Failed |
Succeeded |
|
Green |
Fixed failure |
Succeeded |
Failed |
Both failed or either was skipped or no significant change |
||||
|
Green |
Relative improvement |
Better |
Worse |
|
Red |
Relatively worse |
Worse |
Better |
Additionally, statistically insignificant results have ~ in the ratio column as well.